Share
1.1 Foreword
Valuing Bitcoin can be a challenge as, due to its abstract nature, there is “nothing to relate it to.” However, by shifting the lens through which we view Bitcoin, we can arrive at compelling theories through Metcalfe’s law, Stock-to-Flow, cost of production, market sizing and relating it to a technology start-up. Taken together, the following valuation models can be useful, though individually insufficient. Each model hosts criticisms, accommodating for improvements and adaptations.
Ultimately, Bitcoin’s speculative nature calls to attention the need for more understanding of its various methods of valuation.
1.2 Network Effects (Metcalfe’s Law) Model
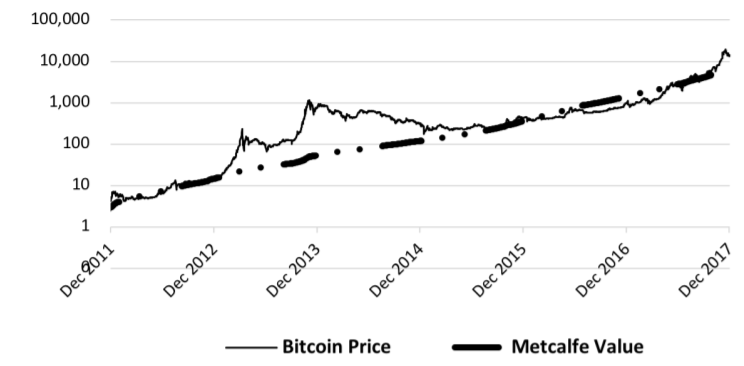
Proponents often view Bitcoin as a network, and look to value it as such. Metcalfe’s law is a concept used in telecommunications in which a network’s inherent value is equal to the square of the number of nodes in its network. In Bitcoin’s case, the growing number of wallets and users reflects increased adoption.
According to Timothy Peterson’s work in Metcalfe’s Law as a Model for Bitcoin’s Value, the model requires three datasets: wallets, number of bitcoins created, and Bitcoin price. As Metcalfe’s law was seen to be too optimistic a figure, Peterson incorporated a method used to measure mobile phone usage. Peterson’s data can be found below, including Metcalfe value against Bitcoin price.

Peterson found the model’s price to be approximately 85% correlated with the market price of Bitcoin. It is important to note, however, that it isn't a “comprehensive valuation model in the strictest sense”.
1.2.1 Criticism
No Agreed Upon Exact Figure for Users
This model refers to users as the number of wallets, which is not necessarily an indicator of the number of users. The latest industry data from glassnode.com currently estimates 140 million users, dwarfing Peterson’s estimate. However, inactive, empty, or non-trading wallets distort the true user base. Most importantly, Bitcoin is not “just” a network, and therefore, is difficult to measure solely on that basis.
1.3 Cost of Production Model
Since the creation of new bitcoins requires electricity consumption via computational power, Hayes (2016) suggests Bitcoin can derive intrinsic value from its cost of production. The Bitcoin mining market is near-perfect competition: numerous participants, low entry/exit barriers, and high mobility create a market where marginal revenue and marginal cost are expected to eventually converge. This cost acts as an absolute floor price: if mining becomes unprofitable, rational miners will buy instead of mine. This relationship mirrors Satoshi Nakamoto’s early writings of price converges to commodity cost.
1.3.1 Criticism
Do Other Commodities Derive Intrinsic Value from Mining?
Gold derives value from demand and its hedging function, not from mining itself. Bitcoin follows this logic. It is not gold mining that gives it value, but the factors forming why people want gold. People mine Bitcoin because others value it; the price reflects the market’s perception of its worth.
Mining Efficiency Increase Does Not Decrease Price
Hayes states that as mining efficiency increases due to technological progress, it is expected to negatively influence the price as it decreases the cost of production. However, Bitcoin’s supply is highly inelastic; reduced mining costs simply intensify competition rather than lower prices. So far, increased mining efficiency has not decreased Bitcoin’s market price. Hash rate rises when mining becomes more profitable, but this only reflects price, it does not drive it.
1.4 Stock-to-Flow (S2F) Model
Another way to value Bitcoin can be as a Store of Value (SoV) commodity. The maximum supply of 21 million coins and diminishing issuance allow valuation by S2F ratios used for SoV commodities (e.g. gold). S2F remains a controversial model within the Bitcoin community, with both critics and supporters.
S2F divides total stock by annual new production (flow). Silver has an S2F of 66.8 years (meaning 66.8 years of production amasses to the current amount available); Bitcoin’s supply schedule is easier to track since issuance halves every four years (“halvings”), eventually reaching zero when the 21 million coin limit is achieved.

Bitcoin’s ratio was ~57 after the 2020 halving and rose to ~120 after the April 2024 halving, significantly exceeding gold. S2F helps measure how much supply enters the market versus existing supply; proponents of this theory argue that a higher S2F signals better long-term SoV qualities, and apply this rationale to Bitcoin.

This value can be written as a power law function, plotted in the graph above. On 25 January 2025, the model predicted US$100,000, 150% above Bitcoin’s actual US$41,454 price. Still, a ~94% historical correlation exists between S2F and market price. External events like regulations and cyber-attacks can affect this correlation. This reinforces the idea that a predominant factor influencing value is captured with S2F.
1.4.1 Criticism
Efficient Market Hypothesis (EMH)
EMH is an economic theory which outlines that markets are information processing systems that deliver the best price discovery. There are three forms of EMH. Weak EMH states historical price data has been priced in. Semi-strong EMH refers to prices factoring in public news, while strong EMH is where all information, public or private, is priced in.
S2F is based on public supply data and should be priced in under EMH. Some argue that few capital controls and dwindling opportunities for arbitrage suggest that Bitcoin has a reasonably efficient market. However, disagreement over Bitcoin’s definition and valuation makes perfect efficiency difficult.
The EMH remains as debated as S2F itself within the bitcoin community.
Infinite Value
The S2F model assumes that mining bitcoins will continue until 2136. When the final block is mined, the value will theoretically be infinite, as there will be no denominator in the S2F ratio to base the model on. Realistically, price would still be driven by supply/demand dynamics as miners continue transaction validation. In line with this criticism a US dollar collapse could also artificially create an “infinite” Bitcoin price measured in USD.
Demand
This model indicates demand but does not directly include it in its predictions. Although supply is consistent, it cannot be changed to meet demand. In the event of a sharp increase in demand, new supply cannot rise to meet it. Regulation or legal changes can also sharply affect demand in ways S2F cannot predict.
Broad Range
The S2F model is not useful for horizons of a quarter or less. During 2013 and 2017 bull runs, prices exceeded the model by 4 times; during bear cycles like 2014–2016 and 2018–2020, prices dropped to half of predicted levels. The model’s error range remains too wide for short-term forecasting.
1.5 Market Size Model
The Market Sizing method can be used by valuing the Bitcoin market against comparable markets, including global remittances and gold. This approach is well suited for gold given the similarities. The implied Bitcoin price can hence be calculated as the level of penetration multiplied by the value of the target market divided by the fully-diluted circulating supply (how much will exist). Lanre Ige and Michael Gotimer from Amun have forecasted paths required for the Bitcoin price to reach gold penetration levels until mid 2025. A penetration rate reflects how much market share Bitcoin gains. For instance, if Bitcoin captures 10% of gold’s market, its price would reach $38,600; at 30% penetration, $115,700. This timeframe is selected to represent an adequate advancement made in Bitcoin’s underlying technology and infrastructure. As Bitcoin’s functionality improves and transaction volumes rise, its market utility grows. Greater utility can lead to broader adoption and a corresponding increased buying power and thus greater market size.
1.5.1 Criticism
Bitcoin’s most ideal comparable market can change over time due to microeconomic factors. Technological changes or new cryptocurrencies may challenge Bitcoin’s dominance. Additionally, legal restrictions or government actions could limit adoption or usage. As Bitcoin’s role in the financial ecosystem shifts, new comparison markets may be more relevant than gold or remittances
1.6 Bitcoin As a Startup Model
Venture capitalists often compare Bitcoin’s development to a tech startup, with each reward era resembling a funding round. SEC Chairman Gary Gensler has noted that most digital assets, excluding Bitcoin, may qualify as securities. Though Bitcoin isn’t a company, its growth shares similarities with startup companies. Fundraising rounds can be compared to Bitcoin’s reward eras, as shown in the below framework chart.

The first reward era (2009–2012) reflects a pre-seed phase: early developers invested time and effort without expectation of return, similar to initial startup builders. These contributors resemble early employees at firms like Google. The next round (seed round) saw the first VCs entering, investing in Bitcoin companies or Bitcoin itself.
In a startup’s “Series A,” capital boosts product and user growth. Bitcoin’s equivalent came through technical upgrades like SegWit, enabling innovations such as the Lightning Network. A startup then uses funding in the Series B round to meet new and increased levels of demand. During Series B, firms scale operations. Bitcoin’s growing adoption, infrastructure, and usage align with this stage, though it has no formal fundraising process. After funding, startups often experience a plateau or adjustment. In Bitcoin’s case, these corrections resemble long bear markets, where price stabilises as development continues. In the world of startups, this would be referred to as “burn rate”.
In its 5th reward era (2024–2028), Bitcoin enters a maturity phase, marked by rising scarcity narratives and broader public influence. Finally, the 6th reward era (2028–2032) may see Bitcoin take on a “blue chip” role, marked by stability, widespread trust, and inflation nearing zero.
1.6.1 Criticism
Bitcoin is most certainly not a start-up company, and should not be valued as one. However, the startup analogy highlights the central role of utility, momentum, and adoption narratives in its evolution.
The content, presentations and discussion topics covered in this material are intended for licensed financial advisers and institutional clients only and are not intended for use by retail clients. No representation, warranty or undertaking is given or made in relation to the accuracy or completeness of the information presented. Except for any liability which cannot be excluded, Monochrome, its directors, officers, employees and agents disclaim all liability for any error or inaccuracy in this material or any loss or damage suffered by any person as a consequence of relying upon it. Monochrome advises that the views expressed in this material are not necessarily those of Monochrome or of any organisation Monochrome is associated with. Monochrome does not purport to provide legal or other expert advice in this material and if any such advice is required, you should obtain the services of a suitably qualified professional.
Related Articles

ESG Series - Governance Part 2: How Poor Governance Leads to Poor Outcomes
Since Bitcoin’s inception in 2008, the interest in Bitcoin and other digital currencies has grown significantly. Between 2010 which saw the very first exchange created which made it simpler to trade bitcoin, to the now arguably saturated marketplace for cryptocurrency exchanges, inadequate governance at cryptocurrency exchanges and other centralised crypto institutions has manifested in poor consumer outcomes.
